// PROJECTS.log
Real Data. Real Pipelines.
End-to-end Azure projects built on open datasets — ingestion through to live dashboards. Each demonstrates the full stack: pipelines, storage, orchestration, and visualisation.
// PROJECT_01
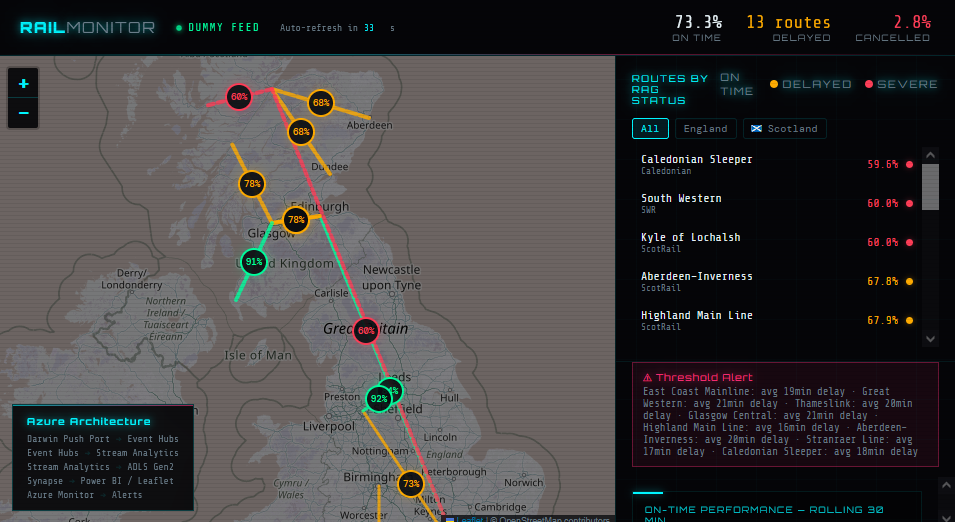
UK Train Performance Monitor
Real-time rail performance tracking across the national network
Ingests live train movement data from the National Rail Darwin API, processing arrivals, departures, and delay events across the UK network in real time. Feeds into a live RAG-status dashboard showing performance by operator, route, and time of day — with anomaly alerting when thresholds are breached.
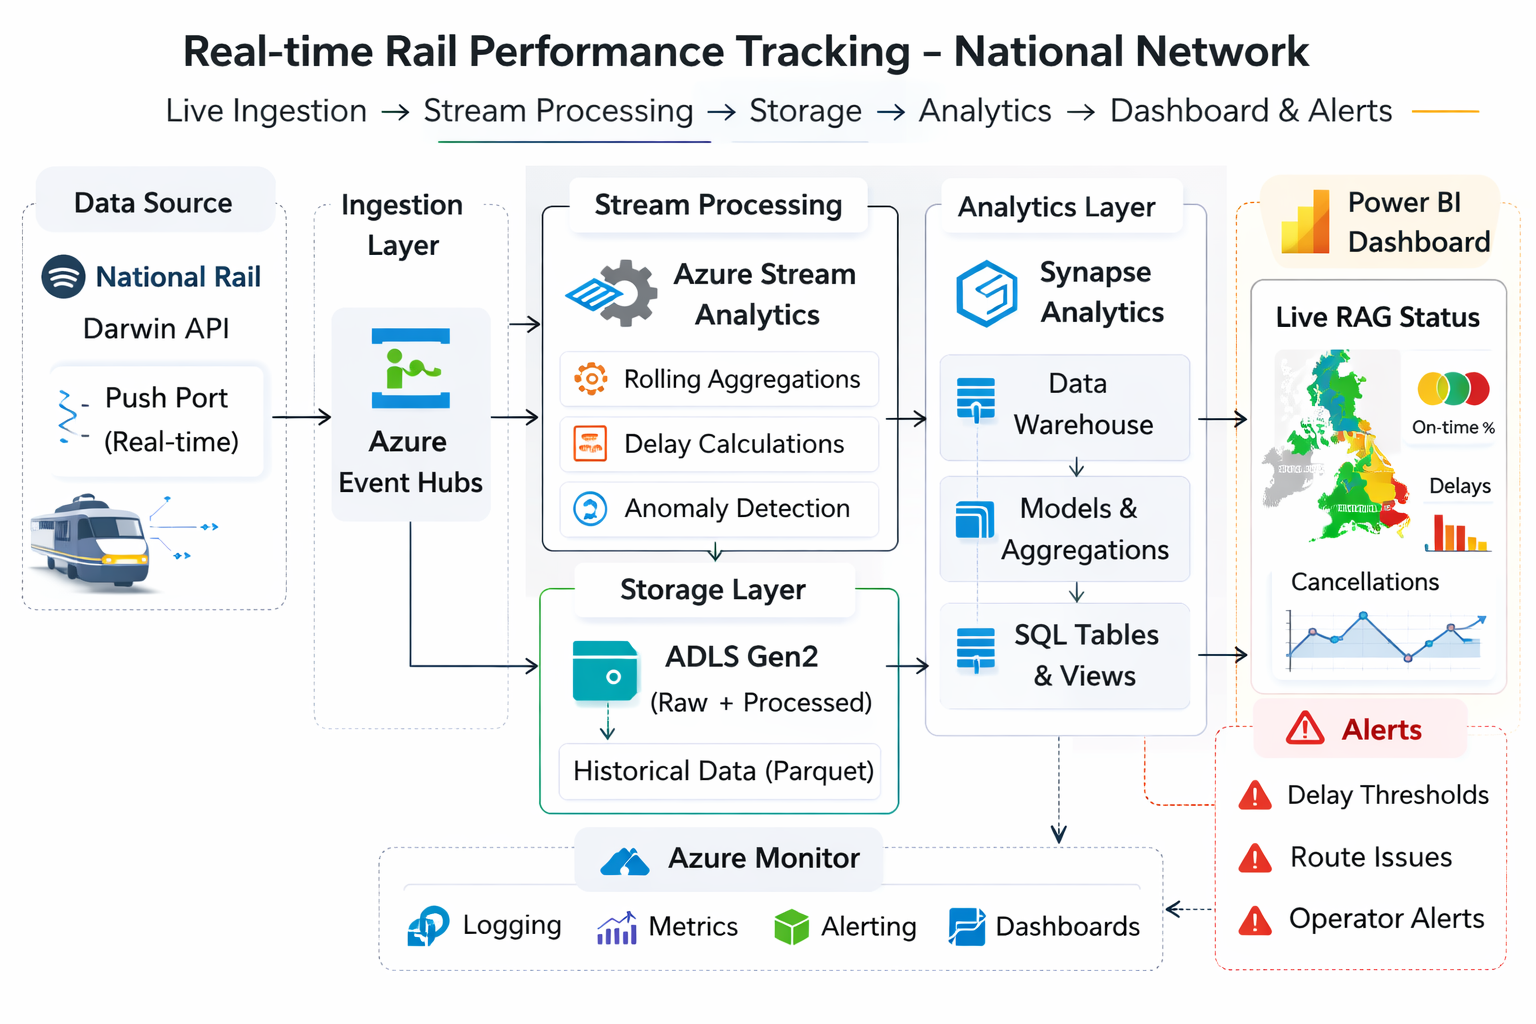
Azure Pipeline (Production Level)
Tech Stack (Production Level)
What It Does
- Live ingestion of train movement messages via Darwin Push Port API into Azure Event Hubs
- Stream Analytics job computing rolling on-time performance, delay distributions, and cancellation rates by operator
- Historical data landed in ADLS Gen2 and modelled in Synapse for trend analysis
- Power BI dashboard with live RAG status map by route, auto-refreshing every 60 seconds
- Azure Monitor alerting when a route exceeds configurable delay thresholds
National Rail Darwin Push Port API (free registration) · networkrail.co.uk/open-data
// PROJECT_02
UK Grid Carbon Intensity
Live carbon tracking across Great Britain's electricity network
Pulls real-time carbon intensity data from the National Grid ESO API, tracking grams of CO₂ per kilowatt-hour by region across Great Britain. Visualises the live energy mix — wind, solar, gas, nuclear — and historical trends over rolling 24-hour and 7-day windows.
Azure Pipeline
Tech Stack
What It Does
- Azure Function on 30-minute timer trigger pulls regional carbon intensity from the National Grid ESO REST API
- Raw JSON landed in ADLS Gen2, transformed via ADF pipeline into structured Azure SQL tables
- Data model tracks intensity by region, generation mix (wind/solar/gas/nuclear/hydro), and timestamp
- Power BI report showing live national intensity, regional heatmap, and 7-day rolling trend
- Demonstrates full ADF orchestration pattern — reusable across any scheduled API ingestion workload
National Grid ESO Carbon Intensity API · api.carbonintensity.org.uk — free, no auth required
// PROJECT_03
Spotify Listening Analytics
Personal music data engineered into a full Azure analytics platform
Connects to the Spotify Web API to extract personal listening history, track audio features — tempo, energy, danceability, valence — and artist and genre data. Builds a full medallion data model in Azure, surfacing listening trends, mood patterns, and top artist breakdowns through a custom embedded JS dashboard.
Azure Pipeline
Tech Stack
What It Does
- OAuth 2.0 token handling via Azure Function to authenticate with Spotify and pull recently played tracks on a schedule
- Raw responses stored in Bronze layer of ADLS Gen2 — ADF pipelines clean and enrich into Silver and Gold layers
- Gold layer data model captures tracks, artists, albums, audio features, and sessions with full dimensional modelling
- Custom JS dashboard embedded in this site — top artists, listening heatmap by hour/day, energy vs. valence scatter, genre breakdown
- Showcases end-to-end medallion architecture, OAuth integration, and custom front-end visualisation without Power BI dependency
Spotify Web API (free developer account) · developer.spotify.com